AI Agents LangGraph
Graph Visualization in LangGraph
Intermediate
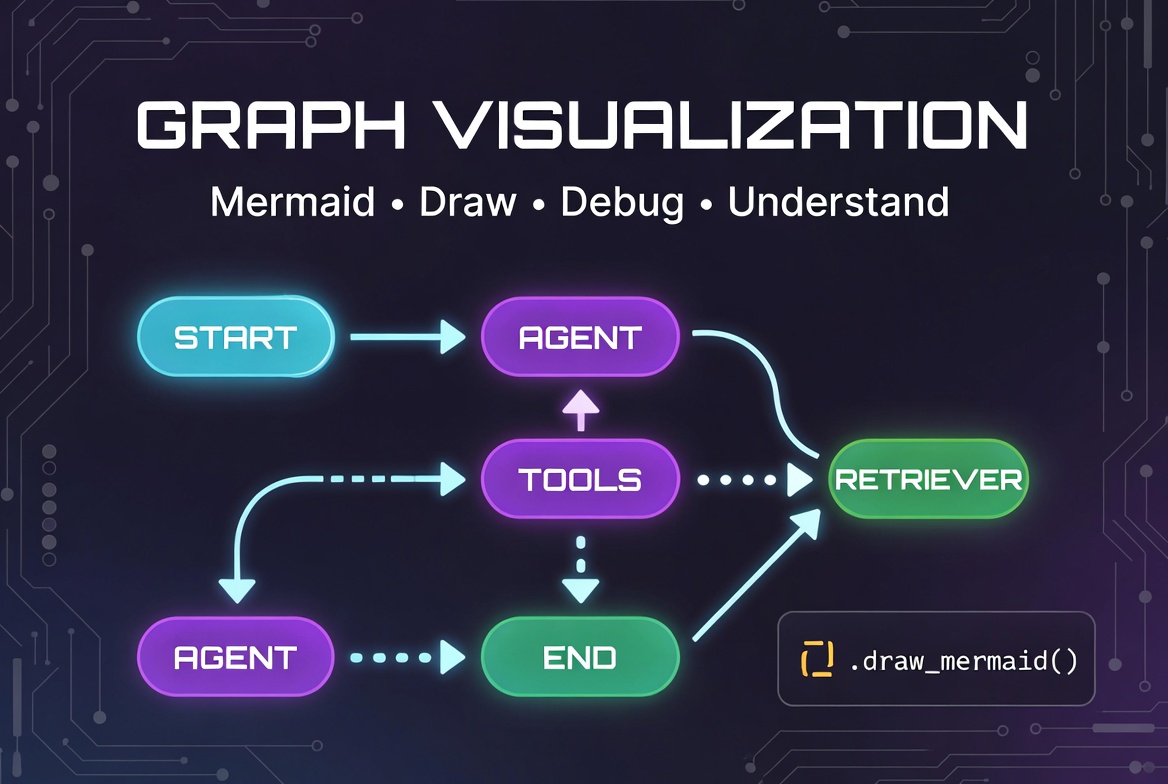
In this topic, we explore graph visualization in LangGraph and learn how to visually inspect workflow structures, execution flows, nodes, edges, cycles, routing logic, and multi-agent systems. We cover Mermaid-based visualization tools such as
get_graph()
,
draw_mermaid()
, and
draw_mermaid_png()
, along with debugging techniques, best practices, common visualization mistakes, and real-world examples for documenting and understanding complex AI workflows.
What Is Graph Visualization?
Why Graph Visualization Matters
- Understand complex workflows quickly
- Debug routing and cycle issues
- Communicate architecture with teammates or stakeholders
- Spot structural problems (missing connections, unreachable nodes, bad cycles)
- Document your agent design
- Onboard new developers faster
Understanding Workflow Structure Visually
- Entry point (START)
- All nodes and their responsibilities
- Flow direction (arrows)
- Conditional branches (dashed or labeled arrows)
- Cycles / loops
- Exit point (END)
- Hierarchical structure (subgraphs)
START → Agent → (Tool Call?) → Tools → Agent (loop) → Final Answer → ENDVisualizing Nodes and Edges
from langgraph.graph import StateGraph, START, END
from langgraph.graph.message import MessagesState

graph = StateGraph(MessagesState)

graph.add_node("agent", agent_node)
graph.add_node("tools", tool_node)
graph.add_node("retriever", retriever_node)

graph.add_edge(START, "agent")
graph.add_conditional_edges("agent", route_tools)
graph.add_edge("tools", "agent")
graph.add_edge("retriever", "agent")
graph.add_edge("agent", END)

# Visualize nodes and edges
print(graph.get_graph().draw_ascii()) +-----------+
START --> | agent |
+-----------+
|
(conditional)
|
+-------+-------+
| |
tools retriever
| |
+-------+-------+
|
agent --> ENDVisualizing Execution Flow
# Generate Mermaid diagram (best for documentation)
mermaid = graph.get_graph().draw_mermaid()
print(mermaid)flowchart TD
START[START] --> Agent[Agent]
Agent -->|Tool Call| Tools[Tools]
Tools --> Agent
Agent -->|Final Answer| END[END]Graph Visualization in LangGraph
The
get_graph()
Method
# On builder (before compilation)
builder_graph = graph.get_graph()
print(builder_graph.draw_mermaid())

# On compiled graph (after compilation)
app = graph.compile()
compiled_graph = app.get_graph()
print(compiled_graph.draw_ascii())# Requires graphviz or matplotlib backend
graph.get_graph().draw_mermaid_png("my_agent_graph.png")
draw_mermaid()
Explained
draw_mermaid()
is the most useful visualization method in LangGraph. It generates
Mermaid flowchart syntax
— a text-based diagram language that can be rendered beautifully in Markdown, Notion, Obsidian, GitHub, Mermaid Live Editor, etc.
from langgraph.graph import StateGraph, START, END
from langgraph.graph.message import MessagesState

graph = StateGraph(MessagesState)
# ... add nodes and edges

# Generate Mermaid syntax
mermaid_code = graph.get_graph().draw_mermaid()
print(mermaid_code)flowchart TD
__start__([START]) --> Agent[agent]
Agent --> Tools[tools]
Tools --> Agent
Agent --> __end__([END])- Works on both builder and compiled graphs
- Clean, readable syntax
- Supports labels on conditional edges
- Excellent for documentation
draw_mermaid_png()
Explained
# Save graph as image
graph.get_graph().draw_mermaid_png(output_file_path="agent_workflow.png")- Usually works out of the box in recent LangGraph versions
- May require matplotlib or graphviz backend in some environments
- Blog posts and tutorials
- Presentations
- Team documentation
- Architecture diagrams
Mermaid Diagrams in LangGraph
- Text-based → version controllable in Git
- Responsive and interactive when rendered
- Supports flowcharts, sequence diagrams, etc.
- Free and widely supported
- Copy the output from draw_mermaid()
- Paste into Mermaid Live Editor
- Or use Markdown in GitHub/Notion:
Reading Mermaid Syntax
flowchart TD
__start__([START]) --> Agent[agent]
Agent -->|Tool Called| Tools[tools]
Tools --> Agent
Agent -->|Final Answer| __end__([END])-
([
START]) → Rounded START node -
[
agent] → Rectangular node -
|
label| → Edge label (for conditional edges) -
-->→ Normal edge -
-.->→ Dashed edge (often conditional)
Visualizing Conditional Edges
def route_tools(state):
if state["messages"][-1].tool_calls:
return "tools"
return "END"
graph.add_conditional_edges(
"agent",
route_tools,
{"tools": "tools", "END": END}
)Agent -->|Tool Calls| Tools
Agent -->|No Tools| ENDVisualizing Cycles and Loops
flowchart TD
START --> Agent
Agent -->|Needs Tool| Tools
Tools --> Agent %% ← Cycle
Agent -->|Done| ENDVisualizing Parallel Flows
Agent --> WebSearch
Agent --> VectorSearch
Agent --> NewsSearch
WebSearch --> Aggregate
VectorSearch --> Aggregate
NewsSearch --> AggregateVisualizing START and END Nodes
- START → Usually shown as a green rounded node labeled START
- END → Shown as a red/purple rounded node labeled END
flowchart TD
__start__([START]) --> Agent[agent]
Agent --> __end__([END])Always visualize your graph before running it. A clear diagram often reveals design flaws faster than reading code.
draw_mermaid()
Explained
draw_mermaid()
is the most important and commonly used visualization method in LangGraph. It converts your graph into Mermaid flowchart syntax — a human-readable, text-based diagram format.
from langgraph.graph import StateGraph, START, END
from langgraph.graph.message import MessagesState
# Build your graph
graph = StateGraph(MessagesState)
graph.add_node("agent", agent_node)
graph.add_node("tools", tool_node)
graph.add_node("retriever", retriever_node)
graph.add_edge(START, "agent")
graph.add_conditional_edges("agent", route_tools)
graph.add_edge("tools", "agent")
graph.add_edge("retriever", "agent")
graph.add_edge("agent", END)
# Generate Mermaid syntax
mermaid_syntax = graph.get_graph().draw_mermaid()
print(mermaid_syntax)flowchart TD
__start__([START]) --> Agent[agent]
Agent -->|tool_calls| Tools[tools]
Tools --> Agent
Agent -->|no_tools| __end__([END])- Works on both the builder (StateGraph) and compiled graph
- Automatically detects and labels conditional edges
- Clearly shows cycles with backward arrows
- Supports subgraphs
draw_mermaid_png()
Explained
# Save as PNG file
graph.get_graph().draw_mermaid_png(
output_file_path="my_agent_workflow.png"
)
# You can also get the image bytes
image_bytes = graph.get_graph().draw_mermaid_png()- Blog posts and documentation
- Presentations and architecture reviews
- Team wikis and Notion pages
- Debugging complex graphs
Mermaid Diagrams in LangGraph
- Text-based (easy to version control)
- Beautiful rendering
- Interactive when used in web tools
- Widely supported (GitHub, Notion, Obsidian, VS Code, etc.)
- Copy output from draw_mermaid()
- Paste into Mermaid Live Editor
- Or embed directly in Markdown:
```mermaid
flowchart TD
START([START]) --> Agent
Agent --> Tools
Tools --> Agent---
### Reading Mermaid Syntax
Understanding Mermaid syntax helps you interpret and customize diagrams.
#### Basic Structure
```mermaid
flowchart TD
__start__([START]) --> Agent[agent]
Agent -->|condition| Tools[tools]
Tools -.-> Agent %% Dashed line = conditional
Agent --> __end__([END])| Symbol | Meaning |
|---|---|
([START])
|
Rounded node (
START
/
END
)
|
[agent]
|
Rectangular node |
-->
|
Solid arrow (normal edge) |
-.->
|
Dashed arrow (conditional edge) |
|label|
|
Edge label (e.g., tool call decision) |
subgraph
|
Used for nested subgraphs |
Visualizing Conditional Edges
def route_after_agent(state):
last = state["messages"][-1]
if last.tool_calls:
return "tools"
elif "research" in last.content.lower():
return "retriever"
else:
return "END"
graph.add_conditional_edges(
"agent",
route_after_agent,
{
"tools": "tools",
"retriever": "retriever",
"END": END
}
)Agent -->|tool_calls| Tools
Agent -->|research| Retriever
Agent -->|else| ENDVisualizing Cycles and Loops
graph.add_conditional_edges("agent", route_tools)
graph.add_edge("tools", "agent") # Creates cycleflowchart TD
START --> Agent
Agent -->|needs_tool| Tools
Tools --> Agent %% ← Clear cycle
Agent -->|final_answer| ENDVisualizing Parallel Flows
Send
) is clearly shown with branching.
from langgraph.types import Send
def parallel_router(state):
return [
Send("web_search", state),
Send("vector_search", state),
Send("news_search", state)
]
graph.add_conditional_edges(START, parallel_router)
graph.add_edge("web_search", "aggregate")
graph.add_edge("vector_search", "aggregate")
graph.add_edge("news_search", "aggregate")START --> WebSearch
START --> VectorSearch
START --> NewsSearch
WebSearch --> Aggregate
VectorSearch --> Aggregate
NewsSearch --> AggregateVisualizing START and END Nodes
flowchart TD
    __start__([START]) --> Agent[agent]
    Agent --> Tools[tools]
    Tools --> Agent
Agent --> __end__([END])- START is typically shown as a green rounded node
- END is shown as a red/purple rounded node
Comparing DAGs vs Cyclic Graphs Visually
flowchart TD
    START([START]) --> Preprocess
    Preprocess --> Retrieve
    Retrieve --> Generate
    Generate --> Postprocess
Postprocess --> END([END])- Linear or tree-like flow
- Each node executes at most once
- Predictable, one-way execution
flowchart TD
    START([START]) --> Agent
    Agent -->|tool_calls| Tools
    Tools --> Agent
Agent -->|final_answer| END([END])- Backward arrows (loops)
- Nodes can execute multiple times
- Represents iterative reasoning (ReAct, reflection, etc.)
Visualization for Documentation
# Best practice for documentation
def save_graph_diagram(graph, filename="workflow.png"):
    # Save high-quality image
    graph.get_graph().draw_mermaid_png(output_file_path=filename)

    # Also save Mermaid source for version control
    with open("workflow.mmd", "w") as f:
        f.write(graph.get_graph().draw_mermaid())

# Usage
save_graph_diagram(graph, "agent_architecture.png")- One main architecture diagram
- Separate diagrams for subgraphs
- Include Mermaid source in Git
- Add annotations explaining key flows
Visualization for Team Collaboration
# During planning / review meetings
print("=== Current Graph Structure ===")
print(graph.get_graph().draw_ascii())

# Share with team
graph.get_graph().draw_mermaid_png("current_design.png")- Non-technical stakeholders can understand the system
- Easier to discuss changes in architecture
- Helps identify design flaws during code reviews
- Great for onboarding new team members
Visualization in Production Systems
# In production code (optional, can be toggled)
if DEBUG_MODE:
    try:
        app.get_graph().draw_mermaid_png("latest_graph.png")
        print("Graph visualization saved for monitoring")
    except:
pass- Monitoring dashboard showing current agent architecture
- Error reporting with attached graph diagram
- Automated documentation generation in CI/CD
- Live system observability
Performance Considerations
-
draw_mermaid()is very fast (text generation) -
draw_mermaid_png()is slower (image rendering)
# Fast - Recommended during development
mermaid = graph.get_graph().draw_mermaid()

# Slower - Use sparingly
if SAVE_IMAGE:
graph.get_graph().draw_mermaid_png("graph.png") # More expensive- Use .draw_mermaid() freely
- Use .draw_mermaid_png() only when you need images
Large Graph Visualization Challenges
- Too many nodes → cluttered diagram
- Deep nesting of subgraphs
- Complex conditional routing
# 1. Visualize only main graph
main_graph.get_graph().draw_mermaid()

# 2. Visualize individual subgraphs separately
research_team.get_graph().draw_mermaid_png("research_subgraph.png")

# 3. Simplify view
# Use .draw_ascii() for quick terminal checks
print(graph.get_graph().draw_ascii())Simplifying Complex Graphs
- Use Subgraphs – Break large graphs into logical modules
- Group Related Nodes – Use clear naming conventions
- Create High-Level vs Detailed Views
- Hide Implementation Details – Show only supervisor + major agents
flowchart TD
    START --> Supervisor
    Supervisor --> Researcher
    Supervisor --> Coder
    Supervisor --> Critic
    Researcher --> Supervisor
    Coder --> Supervisor
    Critic --> Supervisor
Supervisor --> ENDCommon Visualization Mistakes
1. Overcrowded Graphs
# A massive graph with 25+ nodes in one view
graph.get_graph().draw_mermaid_png("full_system.png")2. Poor Node Naming
node_1 --> step3
step3 --> final_processor_v23. Hidden Cycles
Agent --> Tools
Tools --> Agent   %% Cycle is there but not obvious
Without proper layout or comments, cycles can be missed.
4. Unclear Conditional Routes
Agent --> Tools
Agent --> END5. Missing Labels
Best Practices for Graph Visualization
1. Use Clear Node Names
graph.add_node("web_search", web_search_node)
graph.add_node("analyze_results", analysis_node)
graph.add_node("generate_final_answer", final_answer_node)START --> WebSearch
WebSearch --> AnalyzeResults
AnalyzeResults --> GenerateFinalAnswer2. Group Related Nodes
# Create logical groups
research_subgraph = create_research_subgraph().compile()
writer_subgraph = create_writer_subgraph().compile()

main_graph.add_node("research_team", research_subgraph)
main_graph.add_node("writing_team", writer_subgraph)3. Keep Routing Readable
graph.add_conditional_edges(
    "agent",
    route_after_agent,
    {
        "tools": "tools",           # Label will appear as "tools"
        "research": "retriever",
        "END": END
    }
)Agent -->|tool_calls| Tools
Agent -->|needs_research| Retriever
Agent -->|final_answer| END4. Minimize Visual Complexity
- Create multiple focused diagrams instead of one giant one
- Show high-level supervisor flow separately
- Visualize individual subgraphs on their own
- Use .draw_ascii() for quick terminal checks
# High-level view
print(supervisor_graph.get_graph().draw_ascii())

# Detailed view of one component
research_subgraph.get_graph().draw_mermaid_png("research_team.png")
5. Document Important Flows
# Save both source and image
mermaid_code = graph.get_graph().draw_mermaid()

with open("docs/agent_flow.mmd", "w") as f:
    f.write(mermaid_code)

graph.get_graph().draw_mermaid_png("docs/agent_flow.png")

# Add explanation
print("""
Main Flow:
- START → Supervisor routes to specialized agents
- Agents loop with tools until complete
- Final output goes to END
""")AI agent LangChain LangGraph Python